,hl=en,siteUrl='http://0ldfox.blogspot.com/',authuser=0,security_token="v_SeT2Tv8vVdKRCcG9CCW-ZdIfQ:1429878696275"/> Old Fox KM Journal : trading
Showing posts with label trading. Show all posts

Sunday, March 08, 2015

setting circuit breakers

link

step one

max loss per day  x acct size

10,000 x 5%  = 500
x 2%  =  200/day

2,500  x  2%  =  50


2,500 x .05 = 125

max loss per trade
2%

step two

how many losses will you allow in a trading day?

Shawn for instance has 3 losses per 10.
He accounts for 9 losing trades per day, so devide into max loss per day.

$500/9 = $55


Wednesday, May 07, 2014

Watch for GLD to break resistance at 127-128


http://www.morpheustrading.com/blog/right-time-buy-gold-gld-etf/

Then play the single GLD
double DGP
or triple $GLDL or $UGLD
leveraged ETF.

the most influential ETF's to support the long term bull market

link

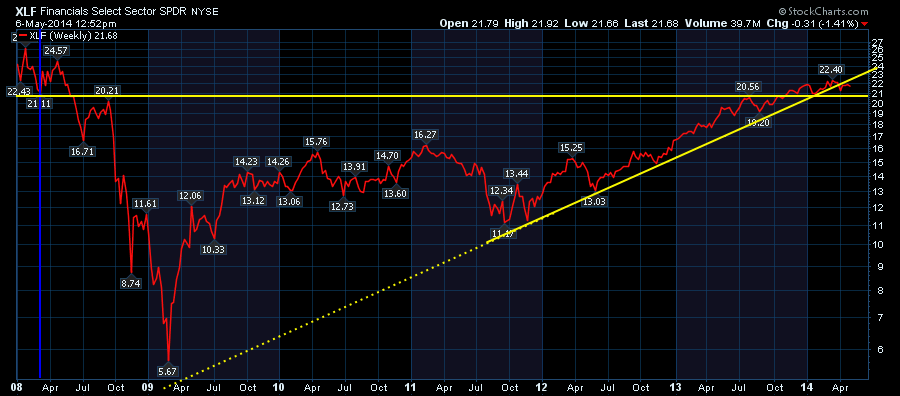
XLF Pauses In The Caution Zone

The XLF ETF - Financial SPDR - is one of the most influential ETF's to support the long term bull market. Bank managers see financial issues before other sectors and the broad array of industries within the financial sector can mask the actual performance of XLF. The sector contains REIT's, Insurance, Regional Banks, and Brokers to name a few. Importantly, the Brokers and Banks are breaking their long trendlines from 2012. Sometimes the long term chart of an entire sector can help us the most as we start to micro analyze the trends. So here is a weekly view  of XLF.  The last support level before the collapse of Bear Stearns is marked with a blue vertical line near the left of the chart. March 10th was the day the Fed announced a $50 Billion Dollar Fund to aid financials institutions in trouble. In the next 4 days, hedge funds redeemed their assets rapidly and removed underlying capital at Bear. (Source- Street Fighters: Kate Kelly) Interestingly enough, while Bear was getting weaker, the financial markets rallies into April. The low of $21.11 on March 10, 2008 was a very significant low in time. The rally up before Lehman's collapse topped out at $20.21. Now with resistance above, the financial sector plummeted.
 In  Q3 2013, the XLF found resistance at $20.56.  In the fourth Quarter of 2013, the financials pushed through this significant resistance level. The January 2014 weekly low bounced at $20.98 which is also very close to the intersection of the two yellow trendlines. This horizontal level marks a long term support level after finding resistance, then support within the range before Bear and before Lehman. Between $20.21 and $21.11 we have a solid level where support and resistance are working. Recently, we broke below the upsloping trend line. Now we have a clear level for our long term stop on XLF. Below support of $20.21 would be a clear breach. This $0.90 zone of support is the line to lean on. Until a move either way breaks, we are in an area of caution under the long term uptrend and above the horizontal support.
If you liked this blog, feel free to forward it to investing friends and family. If you didn't like the blog, please send me a note on what we could do better. The charts should be printable. They should also be clickable so that you can go look at the settings.
We try to keep our articles informative and entertaining. Make sure you check out the other blog writer articles in MailbagChartwatchersTraders JournalDecision Point and The Canadian Technician. One of the little known secrets of StockCharts is our Blog or Articles section. The Blog tab will bring up a view of some of the most recent articles. StockCharts.com subscribers have two additional daily feature articles.
Lastly, Chartcon 2014 in Seattle is rapidly booking up. Click here for more information.
Good trading,
Greg Schnell, CMT

Saturday, March 29, 2014

Cramer and Kudlow...

Cramer now espousing Kudlow's views:


"But, Larry said, what's holding it back? Why aren't we having a more robust economy? Why don't people want to create more businesses?

Indeed, why isn't small business, the true generator of jobs, taking off here? Nine years ago, when Larry and I last worked together, I would never have given him the answer that I tossed out instantaneously to his query: regulation -- too much regulation. My old partner smiled, Cheshire-like, knowing that, somehow, I had come to see the light that he has emitted daily since the ascent of President Obama to the White House.

But how could you not think that? Remember, I am of the micro, and just an hour before sitting down on the set of The Kudlow Report, I had interviewed the CEOs of TriNet (TNET) and Paychex (PAYX) , two immensely profitable companies designed to help small- and medium-sized businesses deal with the government and all of its rules that are now too hard to understand for just about any businessperson. Taxes, mandates, health care, rules for hiring and firing and processing: These are now well beyond the ken of any company, save the multinationals.

So you either use a company such as Paychex or Trinet or Workday (WDAY) or Cornerstone (CSOD) or Automatic Data Processing (ADP), or you succumb to red tape that can either wreck your business or land you in jail. These two alternatives keep you chained to your current enterprise, rather than creating one yourself.

Now, it is easy to argue that the government has simply become much more prolabor and that all of these regulations boost workers' rights. That may be true, but all of that is being sacrificed upon an altar that makes starting a new business too hard to do in the first place. You want to protect workers, but first you have to be able to create a company that can hire those workers, and the rules have simply become too difficult to follow. I know this all too well, not just from the companies in interview, but from the inn and restaurant I own -- two new developments that have emerged since I first sat across from Larry.

I could tell Larry was pleased with my evolution toward his position, even as I sure wish I hadn't needed to evolve at all. And, with that, we smacked fists, as we always did every night on Kudlow & Cramer, and bid each other a fond goodbye. Larry is now embarking on his next chapter of spreading patriotism, optimism and much-needed civility into an American polity starved for all three."

Power Crossover Method
END OF DAY
=============================
Long setup:

MACD Diff (12,26,9)  > 0
RSI (7) > 50
StockD (14,3,3)  > 50

Enter Buy Stop one tick above session's high
---------------------------------------------------------
Short setup:

MACD Diff (12,26,9)  < 0
RSI (7) < 50
StockD (14,3,3)  < 50

Enter Sell Stop one tick below session's high
--------------------------------------------------------
Stop 3% of the stock price.
Target profit 6% of the stock price.


UP NEXT: THE WORLD’S GREATEST CREDIT COLLAPSE

1309Spikes_create_crisis.gif
This chart (a similar version was originally produced by Comstock Partners) shows the age-old story of easy credit. Once rates rise and growth slows, key sectors that took the full advantage of the readily available easy money find the debt they’ve accumulated impossible to pay back. A credit crisis ensues, and financial markets falter. The reliability of this sequence over the last half century allowed The Elliott Wave Financial Forecast to envision key elements of the last crisis well ahead of time. In April 2007, EWFF re-published the above chart from our May 2005 issue, noting a 70% rise in rates that was comparable to prior crisis-inducing spikes. By August 2007, EWFF cited a “succession of climactic credit events, from the bludgeoning of the subprime mortgage market to a booming demand for ‘covenant lite’ commercial loans” and stated that this blend was the “set-up to the onset of a new conservatism that would drive the greatest credit crisis in history.” The yellow highlights on the chart show our forecast for the ensuing months. Over the next two years, the subprime crisis expanded into the biggest real estate crash since The Great Depression; derivatives imploded, which led to the bankruptcy of Lehman Brothers and the forced bailout of financial giants ranging from AIG to Merrill Lynch; GM and Chrysler went under, and 11 airlines became insolvent.

With the help of a historically accommodative Fed, record fiscal stimulus and the decline of U.S. Treasury rates to their lowest level in history, some of the losses have been recouped. But our June 2012 Special Report on the bond market identified a key set-up for the next crisis. The first-ever combined issue of The Elliott Wave Theorist and EWFF called for a “Major Top in the Bond Market” that would lead to outright deflation and an even more devastating credit crisis than that of 2008/2009. U.S. Treasury bonds made a historic top within weeks. Now, a year later, the next crisis is fast approaching.

Through the first half of 2013, EWFF has observed the same climactic credit events that we cited in early 2007. In some ways, the conditions are more extreme, as the demand for junk bonds continued to push yields to a new all-time low in May and covenant lite loans account for twice the percentage of leveraged loans that they did in 2007 (see discussion in the June issue). The broader scope of the unfolding crisis is already evident in a more pronounced interest-rate spike. The 10-year U.S. Treasury yield jumped 97% from its low in July 2012, a one-year percentage increase that is already the largest since interest rates peaked back in 1981. As rates continue higher, trouble will ensue. Many of the borrowers that managed to survive or were bailed out during the last credit crisis are barely hanging on despite the rate relief and economic recovery. For example, since 2009, 46% (306,000) of the homeowners that received help from the U.S. government’s main foreclosure prevention program have “re-defaulted.” In the resuming crisis, credit stress will reappear in all of the areas that EWFF cited in 2007. Additionally, whole new areas of default will become focal points, as the orange highlighted list on this next chart shows. Let’s look at some of the upcoming attractions:
1309spike_sets_up_bigger_crunch.gif
Emerging Markets
Emerging market debt is assuming the lead role played by subprime debt in 2007. Just as the market for subprime debt buckled ahead of the stock market top of in July 2007, emerging market rates, particularly in China, came unhinged in June (see discussion in Global Rap section of last month’s issue), ahead of what should be an imminent peak in the Dow Industrials. In 2007, EWFF observed that investors initially dismissed the subprime threat, citing “‘no clear signs’ of rising trouble in the debt market.” Here again, investors are unfazed. Some even insist that the initial scare creates “a lot of opportunities” (“Goldman Sachs Likes Emerging Market Bonds,” WSJ, July 11). The lack of concern is particularly pronounced when it comes to China. “If You Think China Is Facing a Credit Crunch, You’re CRAZY!” exclaims a Business Insider headline.


Still, some areas of easy money continue to flow even as prior spigots run dry. A July 18 Bloomberg article notes that while China’s cash squeeze is claiming domestic victims “across the nation,” Chinese money remains “cheap and plentiful” in distant markets such as Nigeria, Sudan, Russia and the Ivory Coast. In “some of the world’s riskiest” markets, Chinese banks are lending at “hundreds of basis points below the cheapest commercial loans available.” “It’s almost free money,” says a Nigerian aviation minister who just borrowed $500 million to build four airports at an interest rate of 2%. The cheap foreign lending is done through “policy banks” and is intended to facilitate Chinese business interests. In our book, it is just another example of how government is taking a lead role in the last vestige of the old trend. Because government is driven by consensus, it commits most fully to financial trends when they are over or nearly so.

Wednesday, December 14, 2011

Thursday, May 06, 2010

Momentum EA

link
Momentum EA Puts Up Shocking Numbers
Submitted by Jason Fielder on April 1, 2010 – 9:05 pmNo Comment.

Every once in a while, I have what I’d like to call a “moment of clarity”. Recently, I was thinking about how to use what MetaTrader has already given us (in the way of indicators) to build a complete system with. As I was thinking about what indicators to put together to logistically create a new system, I thought to myself — “why not make a system simply with two of the SAME indicator?”. Thus, the “Momentum Cross” system was born. As it was being coded and tested by my system developers and myself, I didn’t know what to expect. The results shocked me, and I felt like I just HAD to share it with all of you.


As some of the other trading labs, the rules to this system are relatively simple as well. I only use one indicator, but I use two of them (with different settings):

#1 - Momentum indicator with the setting of “1″ on Close price
#2 – Momentum indicator with the setting of “8″ on Close price
NOTE: For the long and short examples below, when I say “#1 momentum indicator” and “#2 momentum indicator”, look at the above #1 and #2 for reference.

For a long: The #1 momentum indicator is currently GREATER than the #2 momentum indicator. The previous candle must have the #1 momentum indicator SMALLER than the #2 momentum indicator. So, as soon as they cross on the current candle, if the current candle is a LONG candle (current close is above current open), then go long as soon as the 2 indicators cross.

For a short: The exact same entry rules for a long (#1 momentum indicator going above #2 momentum indicator on THIS candle, etc.). Except, if the current candle is a SHORT candle (current close is below current open), then go short as soon as the 2 indicators cross.

It seems odd and awkward to have 2 different momentum indicators, and having to compare the values on each tick. So, to make things easier, we took the liberty of the “weekly indicator” to build you a FXI-MomentumCross indicator!! This will allow you to have a MACD-style indicator that is simply the 2 momentum indicators on top of one another. Check the weekly indicator for this week if you would like this indicator (optional to run this system, not required).

When I tested this, I tested 2 different variables:

1) Left the “fast” Momentum indicator at 1, but tested the “slow” Momentum indicator (everything from 3 to 10). The “8″ setting was consistently best, so ALL the tests were run with a “1″ in the fast momentum setting, and a “8″ in the slow momentum setting.
2) Tested the stop loss and take profit, at a 1 to 1. On the hour, tested everything from 20 to 60. On the 4H, tested everything from 50 to 150. And on Daily, everything from 50 to 300.

We tested on both a short term timeframe (everything from December 2009 to present date), and a long term timeframe (everything from January 2007 to December 2009). Check the results in the video below to see me walk through how this system performed, and what to look for.

First, the EA link. But before that…

VERY IMPORTANT: The Expert Advisor That Is Given To You In This Trading Labs Is Provided AS IS And For EDUCATIONAL PURPOSES ONLY. If you decide to trade this EA on your account and it blows it up to smitherines, we can NOT be held liable. It is a tool, and all tools in this world can be considered dangerous. Just be careful, and if any losses at all occur on your account, remember…you have been warned. It is NOT our fault if either this system doesn’t perform, or the EA doesn’t perform as expected. – With that being said here you go!

1) Click HERE To Download This Expert Advisor. Save it somewhere easy to find, such as your desktop.
2) Move the Expert Advisor into your “MetaTrader 4 Directory\experts” folder.
3) Re-start your MetaTrader 4 if it is already running.
4) You may now use the Expert Advisor for your testing or trading purposes. You should be able to see it in the “Navigator Window” now underneath the “Expert Advisors” tree.


Here is a listing of the variables (as well as their default values):


– Momentum Settings –
MomentumSlow = 1 <– Slow Momentum Value MomentumFast = 8 <– Slow Momentum Value MomPriceFast = 0 <– Applied Price — 0=Close;1=Open;2=High;3=Low;4=Median;5=Typical;6=Weighted MomPriceSlow = 0 <– Applied Price — 0=Close;1=Open;2=High;3=Low;4=Median;5=Typical;6=Weighted – Trading Options – StopLoss = 25 <– Trade Stop Loss TakeProfit = 25 <– Trade Take Profit LotSize = 0.1 <– Lot Size Per Trade MagicNumber = 123456 <– Magic Number (make this number unique) – EA Options – ShowAlerts = true <– Show audio/visual alerts on each new order ShowSystemStats = true <– Show total system profit (over history) on the chart

Wednesday, May 05, 2010

New Trade - WDC

WDCWestern Digital Corp.
Buy to Open300@$42.79

WDC 2010 OCT 46.00 PUT
Buy to Open3@$6.70

Bought shares of WDC$42.79
BTO Oct 2010 46 Put+$6.70
Total Investment$49.49
Guaranteed Return-$46.00
Total amount AT RISK$3.49or 7.1%

Sunday, August 19, 2007

Incredible Charts


For Stocks or Forex. Place orders, stops, limits right on the chart. Incredibly cool!

Incredible Charts


For Stocks or Forex. Place orders, stops, limits right on the chart. Incredibly cool!


$1 Forex Software Trial
Learn to Trade the Forex in 10 Days 
Exact Entry, Exit and Stop Signals
Click Here to Start Your $1 Trial


Friday, May 11, 2007

On the Cuff...


link
"Seemingly (credit) is a perpetual motion machine; but one day the lever will go into reverse, and the value of total credit will shrink as dollar prices collapse."
- Bob Prechter, The Elliott Wave Theorist, May 2007

As calls for Dow 14,000, Dow 15,000 and higher flood the media while any talk of credit inflation is tossed to the compost heap, it's increasingly evident – and not surprising – that there are few bears in sight. It couldn't be clearer that investor optimism abounds, setting astonishing records in recent months. Yet not once in history have the financial markets taken extreme credit inflation as a sign of anything but an impending deep and debilitating decline. There's something so obviously wrong with this picture.

In the May 2007 issue of The Elliott Wave Theorist, Bob Prechter talks about the ultimate affects of a credit society in a way that you won't hear from any other source. As one of Bob's most detailed Theorists on the financial markets, this is a must-read issue...

Sunday, April 01, 2007